USD/JPY Price Analysis: Erases Monday’s losses, reclaims 131.00 on US Dollar strength
- The USD/JPY reached a six-month low at 129.50 but recovered some ground, albeit US Treasury yields fell.
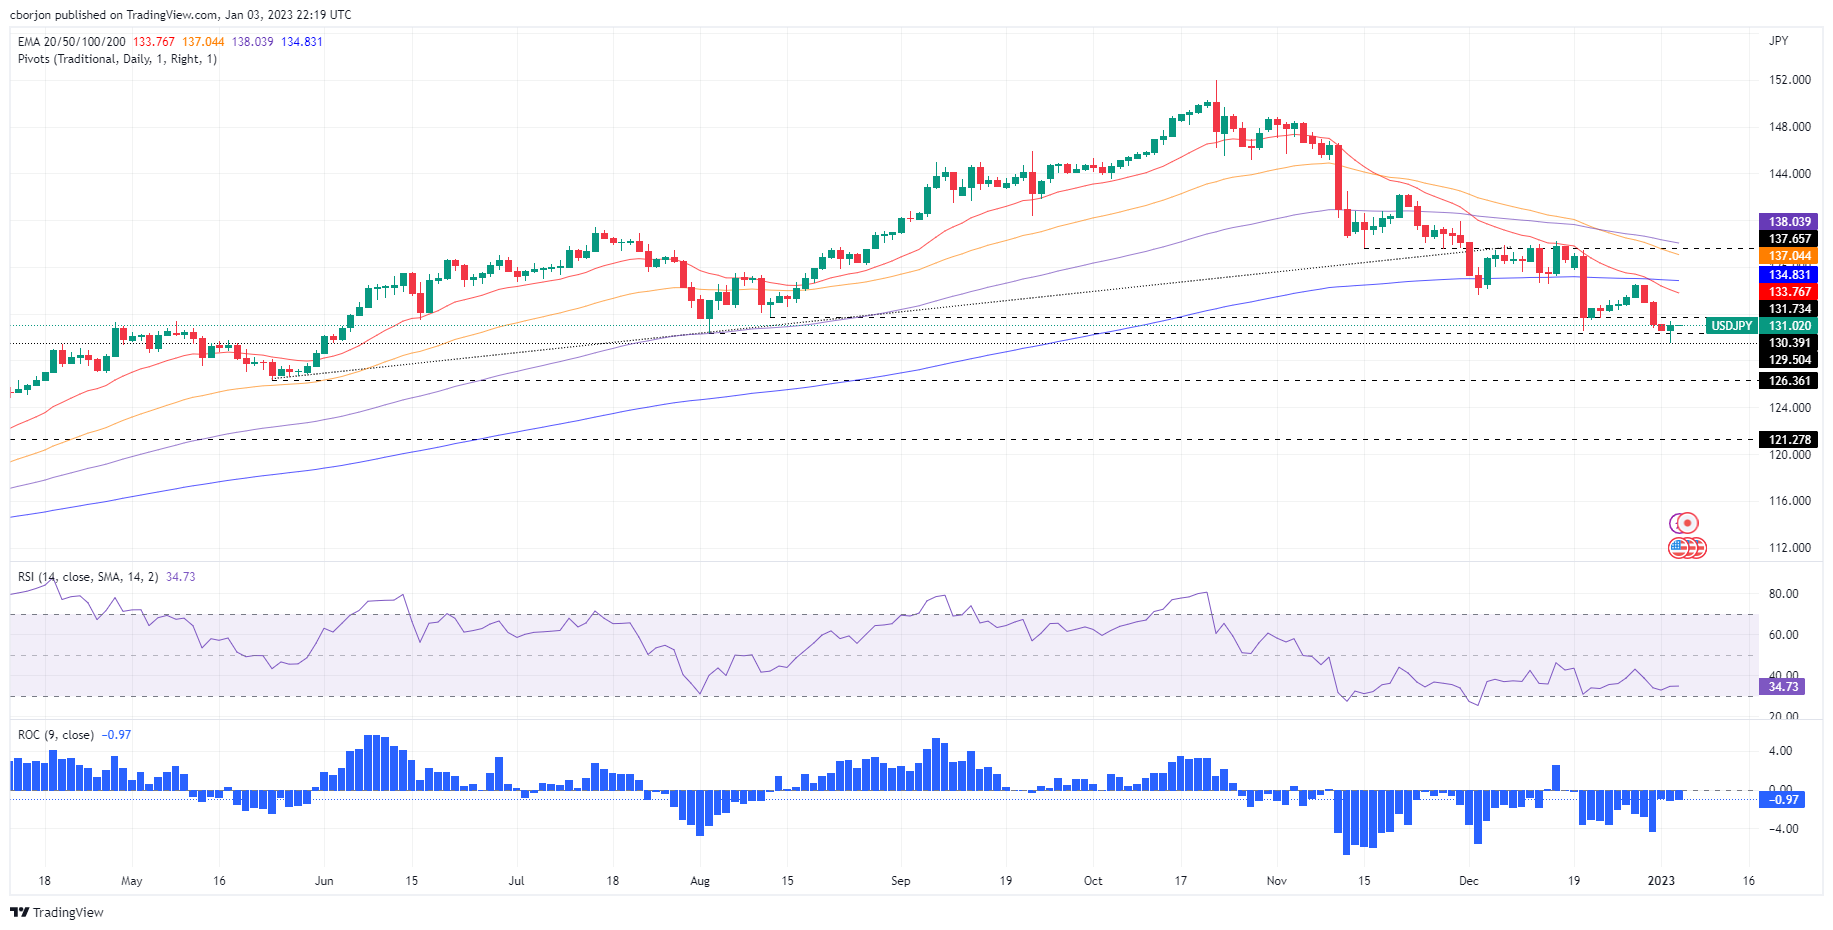
- USD/JPY Price Analysis: Downward biased, but short term might test the 20-day EMA around 133.76.
The USD/JPY climbs sharply after dropping to eight-month low levels, last seen in June 2021 around 129.50, at around 130.90s, as the US Dollar (USD) emerges as the strongest currency in Tuesday trading. Therefore, the USD/JPY is trading at 131.01, above its opening price by 0.25%.
USD/JPY Price Analysis: Technical outlook
On Tuesday, the USD/JPY daily chart portrays the pair as downward biased. However, Tuesday’s price action formed a hammer preceded by a downtrend, suggesting that buyers outpaced sellers, suggesting that the USD/JPY might print a leg-up before continuing its downtrend. The bias would remain intact as long as the USD/JPY stays below the 20-day Exponential Moving Average (EMA) at 133.76. Otherwise, it would pave the way for a test of the 200-day EMA at 134.83, which, once cleared, could send the USD/JPY rallying to the 50-day EMA at 137.04
Oscillators like the Relative Strength Index (RSI) remain in bearish territory, while the Rate of Change (RoC) displays selling pressure waning.
Therefore, the USD/JPY first resistance would be the 132.00 mark. A breach of the latter would expose the December 30 daily high of 133.09, followed by the 20-day EMA at 133.76..
USD/JPY Key Technical Levels