Gold Price Forecast: XAU/USD shows volatility contraction near $1,840, FOMC minutes eyed
- Gold price has dropped to test the breakout from the Ascending Triangle around $1,825.00.
- Expectations of a higher interest rate peak by the Fed have triggered a risk-off market mood.
- The USD Index has climbed above 104.30 amid bumper consensus for December’s NFP data.
Gold price (XAU/USD) has shifted into a sideways auction profile after recovery from the crucial support around $1,828.00 in the late New York session. Earlier, the precious metal slipped sharply after failing to kiss the critical resistance of $1,850.00. The yellow metal is displaying a volatility contraction ahead of the release of the Federal Open Market Committee (FOMC) minutes.
Risk-perceived assets like S&P500 witnessed heat on Tuesday as investors are expecting a hawkish policy outlook from the FOMC minutes, which will release on Thursday. As the inflation rate is still stubborn and the labor market is extremely tight, the Federal Reserve could look for more interest rate hikes to compensate for a healthy Consumer Price Index (CPI). The 10-year US Treasury yields dropped to 3.75% despite a risk aversion theme in the global market.
The US Dollar Index (DXY) climbed above 104.30 after defending the downside bias below the major support of 103.00. The USD Index is gaining strength in anticipation of higher employment generation by the United States economy in the month of December. Analysts at TD Securities are anticipating a very solid net gain in December at 350k.
Gold technical analysis
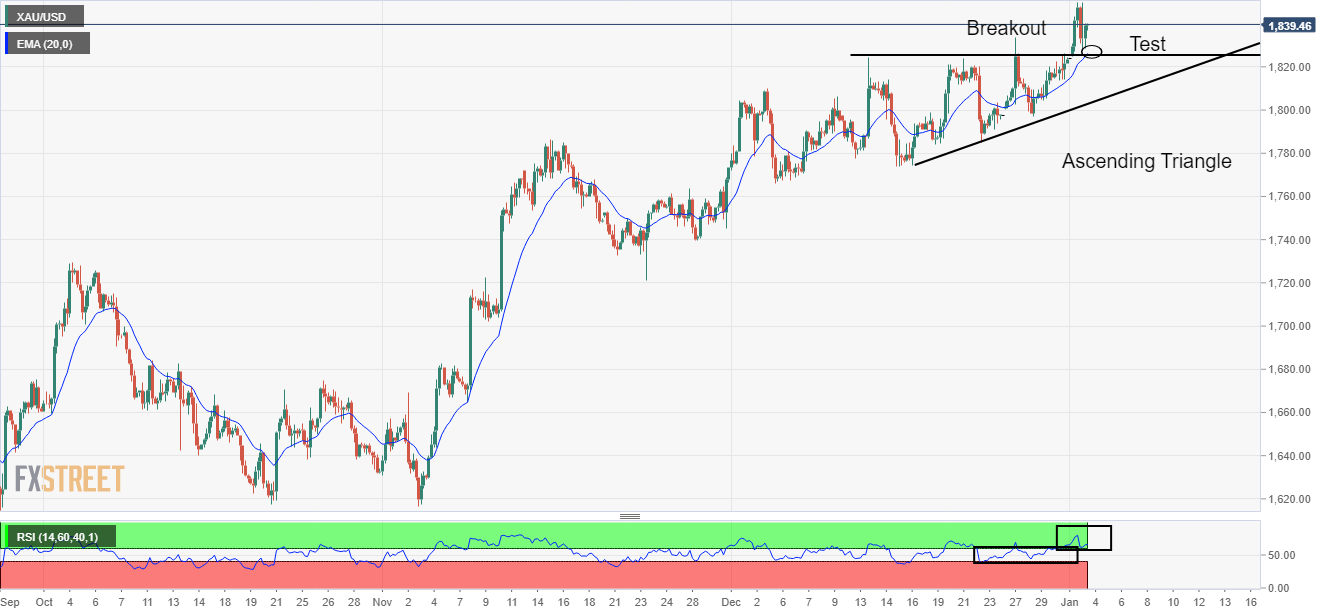
After a breakout of the Ascending Triangle chart pattern, Gold price has reversed to test the breakout region near the horizontal resistance of the chart pattern placed from December 13 high around $1,825.55. The 20-period Exponential Moving Average (EMA) around $1,825.00 is acting as major support for the Gold price.
The Relative Strength Index (RSI) (14) has shifted into the bullish range of 60.00-80.00 from the 40.00-60.00 range, which indicates more upside ahead.
Gold four-hour chart