Back
4 Feb 2019
US Dollar Index Technical Analysis: Consolidative Tuesday for the Greenback
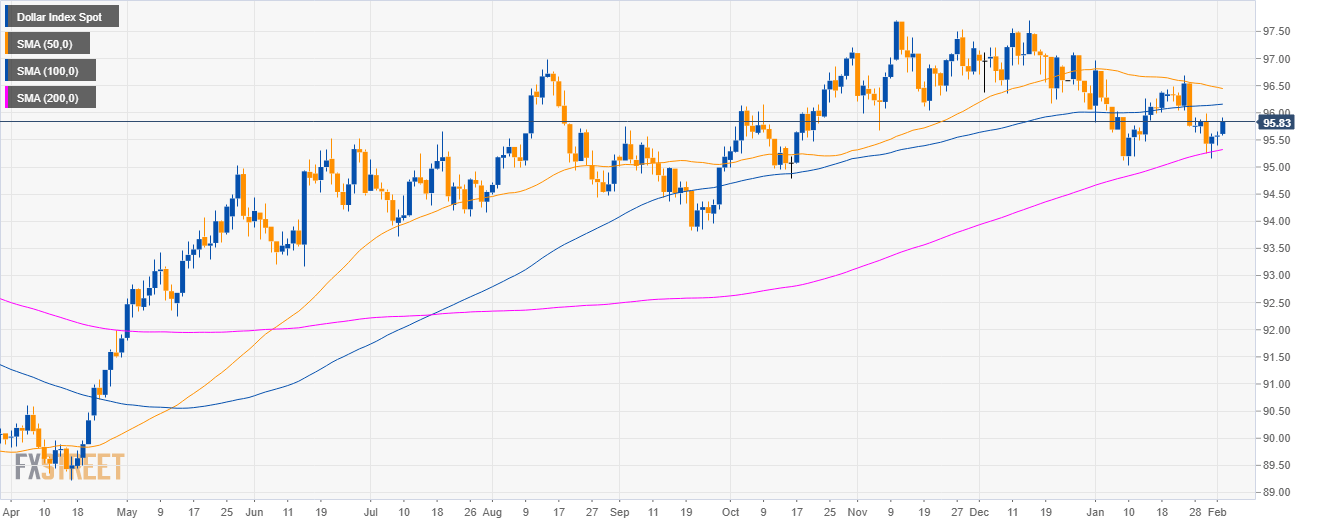
DXY daily chart
- The US Dollar Index (DXY) is in a bull trend above 200-day simple moving average (SMA).
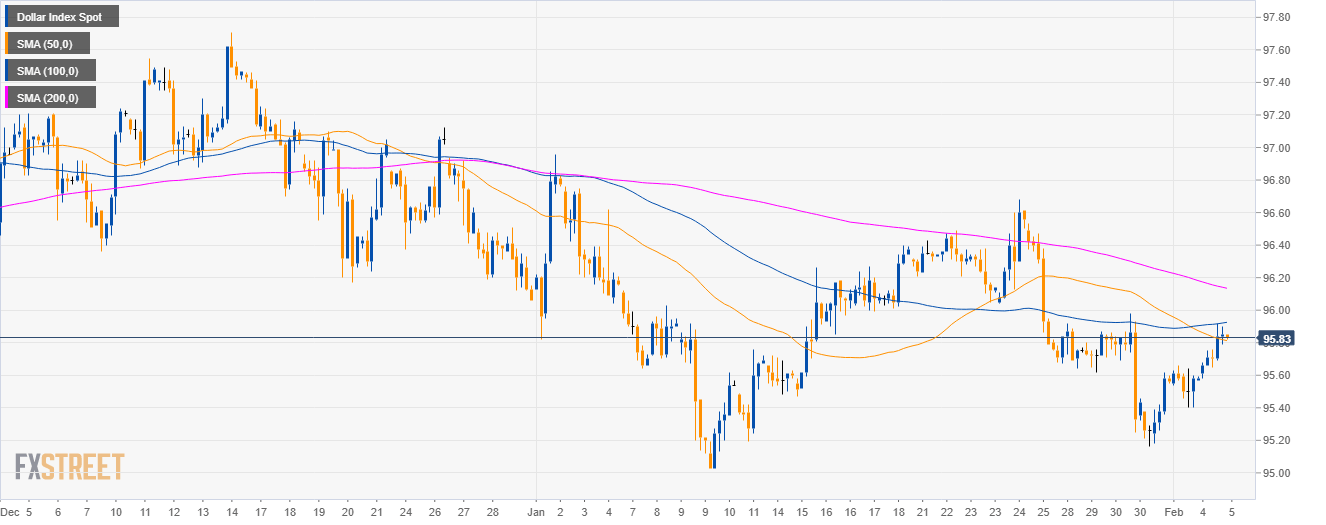
DXY 4-hour chart
- DXY is trading below its 100 and 200 SMA suggesting bearish momentum in the medium-term.
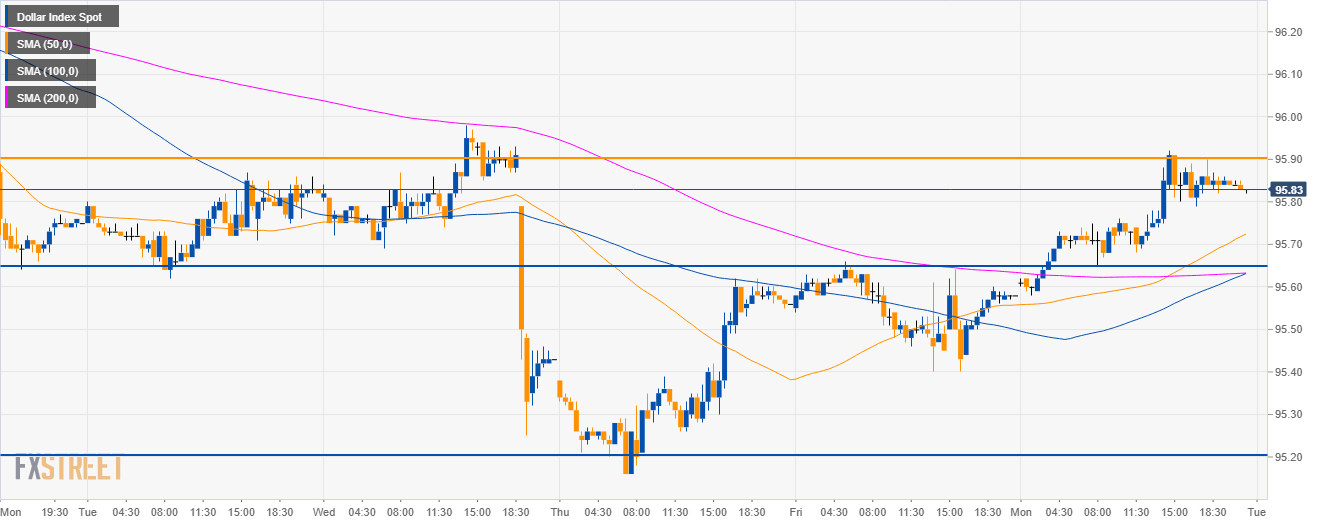
DXY 30-minute chart
- DXY is trading just below the 95.90 resistance.
- Bears will most likely want to resume the move initiated last week by trying to reach the 95.65 level.
Additional key levels
Dollar Index Spot
Overview:
Today Last Price: 95.83
Today Daily change %: 0.26%
Today Daily Open: 95.58
Trends:
Daily SMA20: 95.87
Daily SMA50: 96.47
Daily SMA100: 96.15
Daily SMA200: 95.3
Levels:
Previous Daily High: 95.66
Previous Daily Low: 95.4
Previous Weekly High: 95.98
Previous Weekly Low: 95.16
Previous Monthly High: 96.96
Previous Monthly Low: 95.03
Daily Fibonacci 38.2%: 95.56
Daily Fibonacci 61.8%: 95.5
Daily Pivot Point S1: 95.43
Daily Pivot Point S2: 95.29
Daily Pivot Point S3: 95.17
Daily Pivot Point R1: 95.69
Daily Pivot Point R2: 95.81
Daily Pivot Point R3: 95.95