S&P500 Technical Analysis: US Stocks trading at 3-month's highs
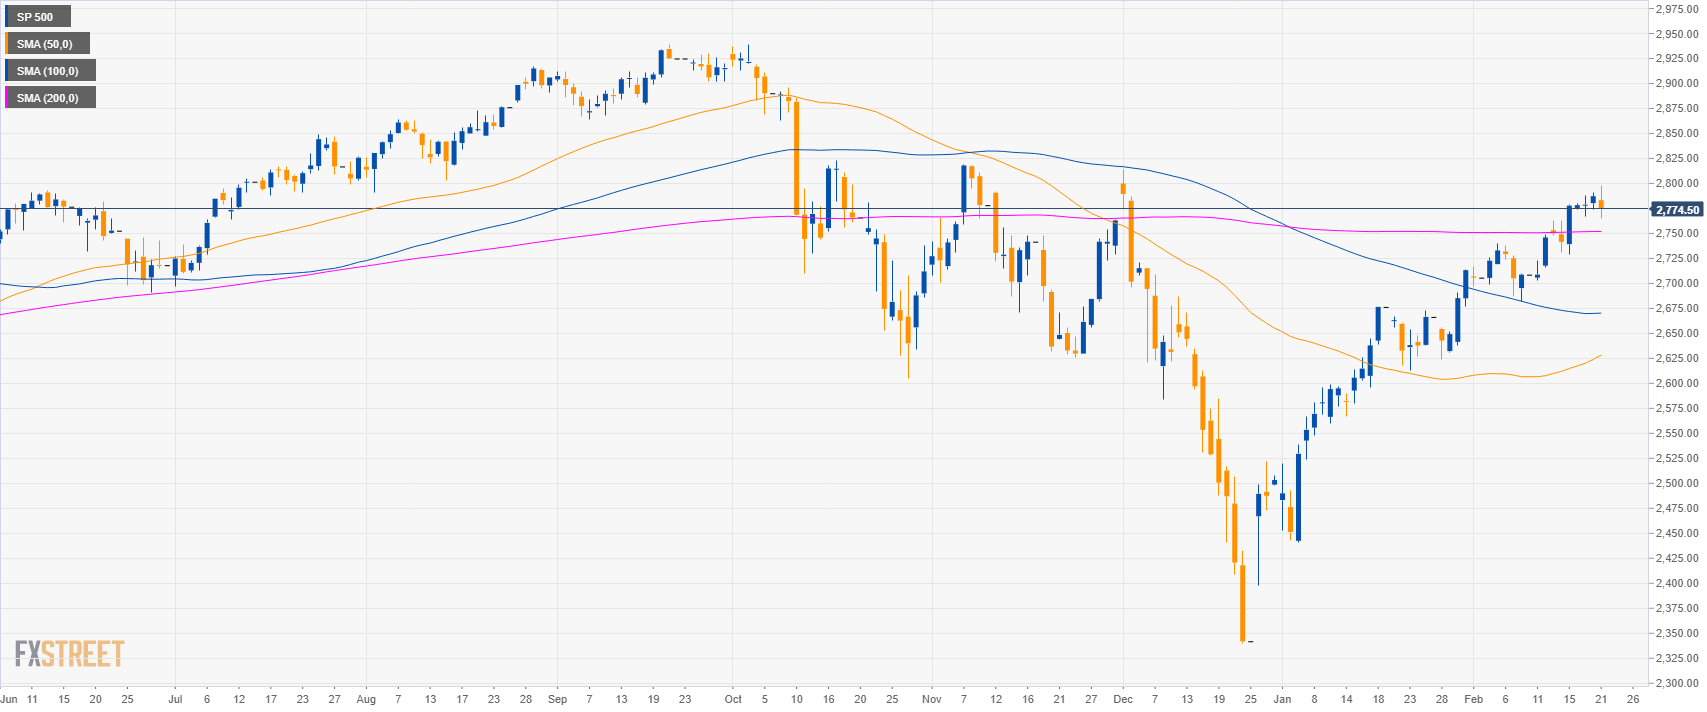
S&P500 daily chart
- The S&P500 broke above the 200-day simple moving average as bulls are trying to regain control.

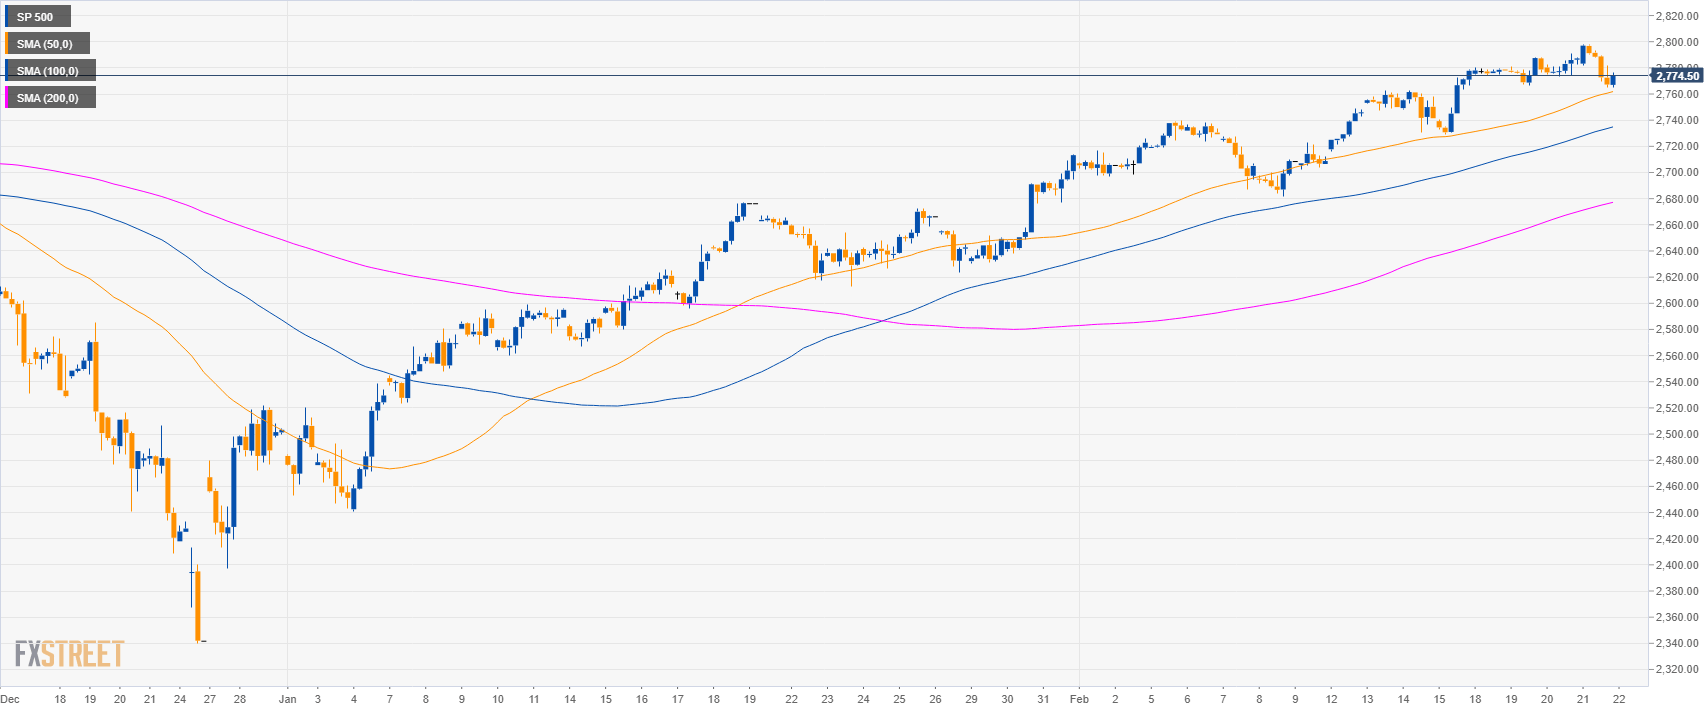
S&P500 4-hour chart
- The S&P500 is trading above its main SMAs suggesting bullish momentum in the medium-term.
- The bulls are likely looking at the 2,815.00 resistance.

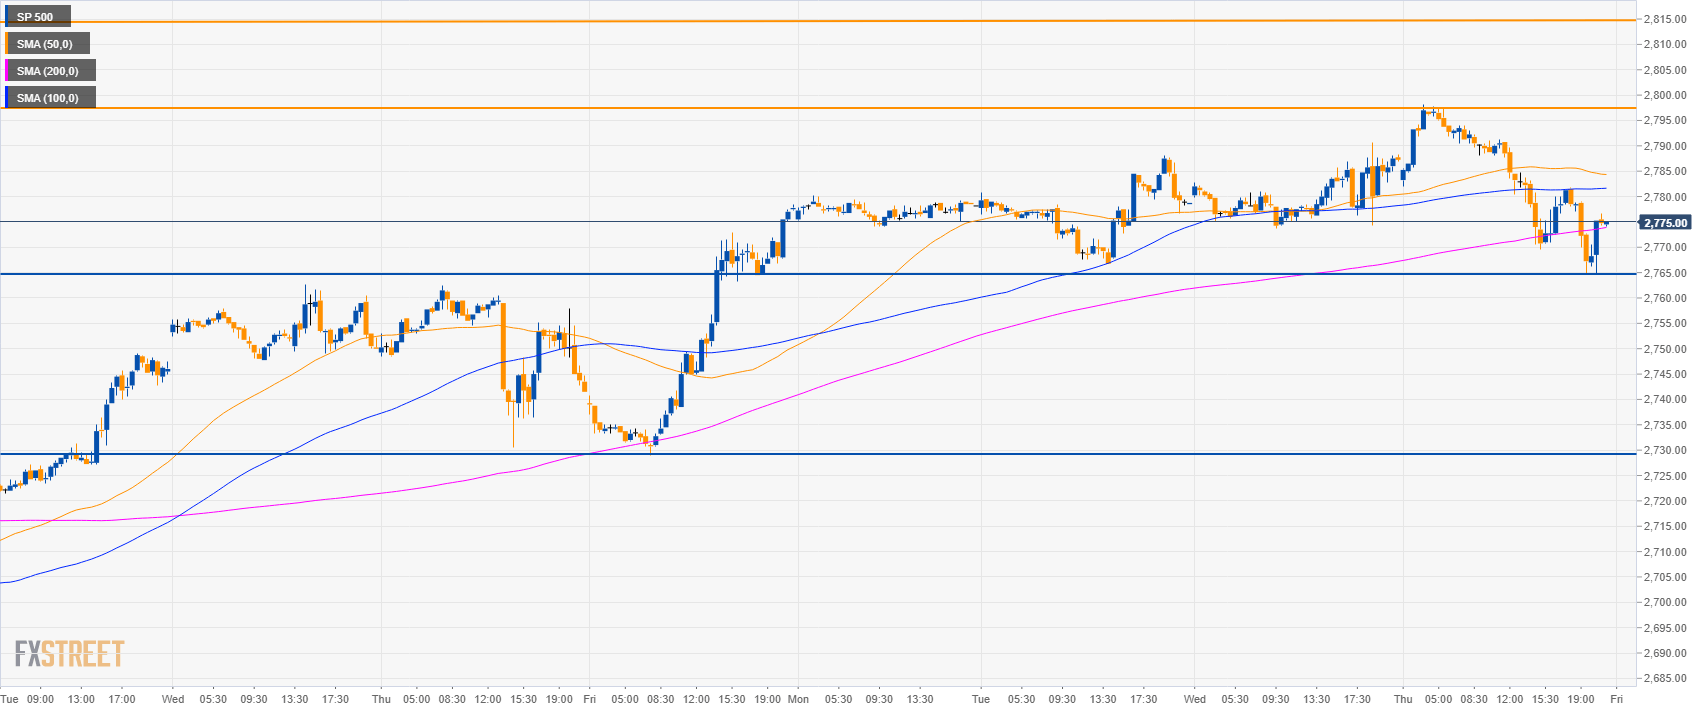
S&P500 30-minute chart
- The S&P500 is trading between the 100 and 200 SMAs suggesting a sideways market in the short-term.
- Bulls need to overcome 2,780.00 resistance to reach 2,800.00 and 2,815.00 levels.
- To the downside, support is at 2,765.00 and 2,730.00 level.

Additional key levels:
SP 500
Overview:
Today Last Price: 2774.25
Today Daily change: -13.00 points
Today Daily change %: -0.47%
Today Daily Open: 2787.25
Trends:
Daily SMA20: 2723.89
Daily SMA50: 2623.9
Daily SMA100: 2669.96
Daily SMA200: 2751.9
Levels:
Previous Daily High: 2790.75
Previous Daily Low: 2773.75
Previous Weekly High: 2778.5
Previous Weekly Low: 2702.5
Previous Monthly High: 2714
Previous Monthly Low: 2441
Daily Fibonacci 38.2%: 2784.26
Daily Fibonacci 61.8%: 2780.24
Daily Pivot Point S1: 2777.08
Daily Pivot Point S2: 2766.92
Daily Pivot Point S3: 2760.08
Daily Pivot Point R1: 2794.08
Daily Pivot Point R2: 2800.92
Daily Pivot Point R3: 2811.08
