Back
20 Mar 2019
NZD/USD Technical Analysis: Sellers aim for 0.6810/05 after breaking immediate supportline
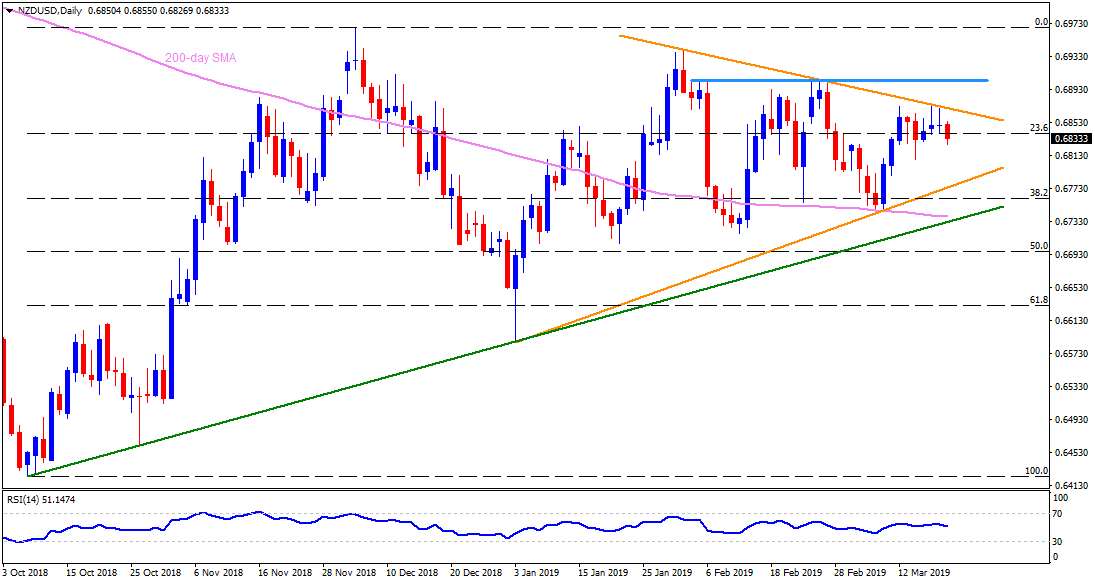
NZD/USD daily chart
- NZD/USD is trading near 0.6830 during early Wednesday.
- The quote reversed from seven-week-old descending resistanceline on Tuesday while its dip beneath immediate trend-line support validates further downside.
- In doing so 0.6810/05 area comprising March 13 low and March 08 high is likely immediate support, a break of which can magnify the weakness towards an upward sloping suppportline stretched since early-January at 0.6770.
- However 200-day simple moving average (SMA) at 0.6735, followed by five-month-old ascending trend-line at 0.6730, could limit further declines.
- Alternatively, sustained break of 0.6875 becomes prerequisite for pair to mark a recovery in a direction to 0.6905/10 resistance region.
- Also, the pair’s extended rise above 0.6910 enables it to aim for 0.6940, 0.6975 and 0.7000.

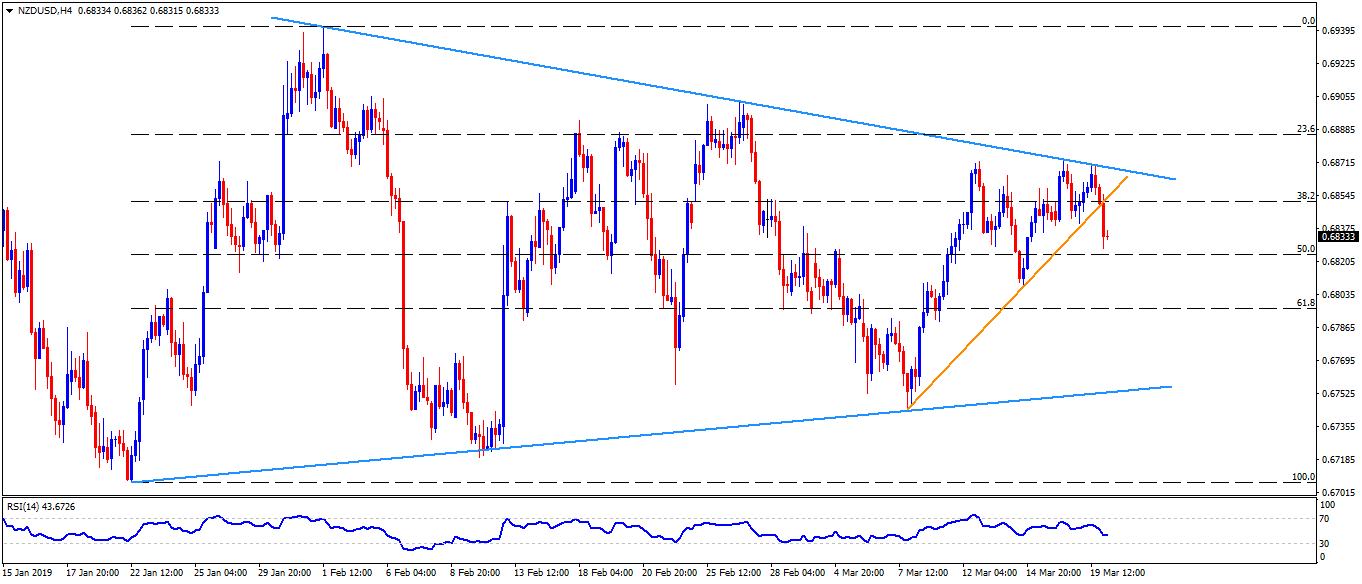
NZD/USD 4-Hour chart
- An intermediate ascending support-line at 0.6755 can try restricting pair’s slip below 0.6770 towards 0.6735.
- 0.6925 seems a small stop in between 0.6910 and 0.6940.

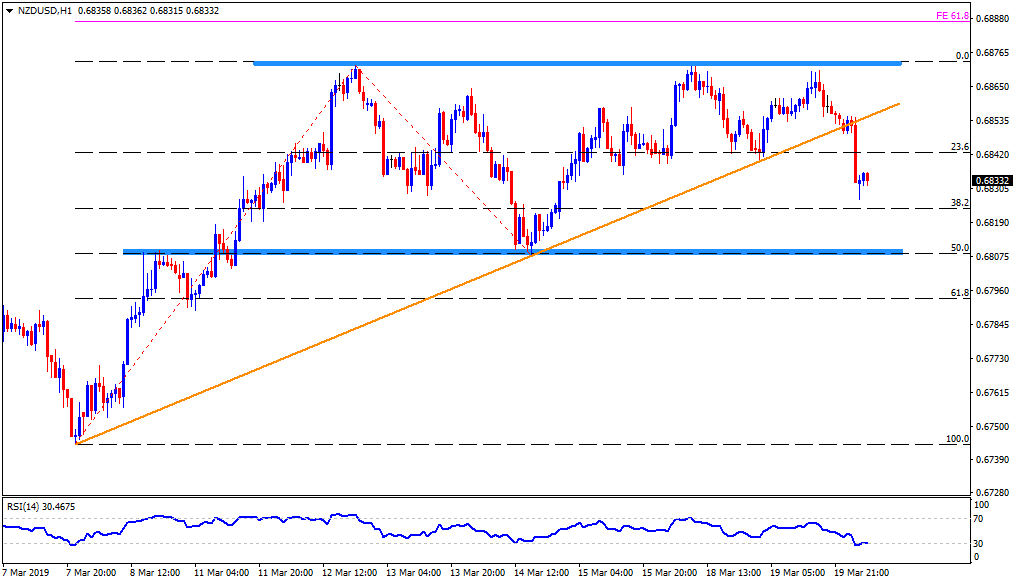
NZD/USD hourly chart
- 0.6790 could appear as a support after 0.6805 in a direction to 0.6770.
- Also, 0.6890 might entertain short-term buyers beyond 0.6875.

