Back
10 Apr 2019
GBP/USD Technical Analysis: Cable directionless amidst Brexit chaos
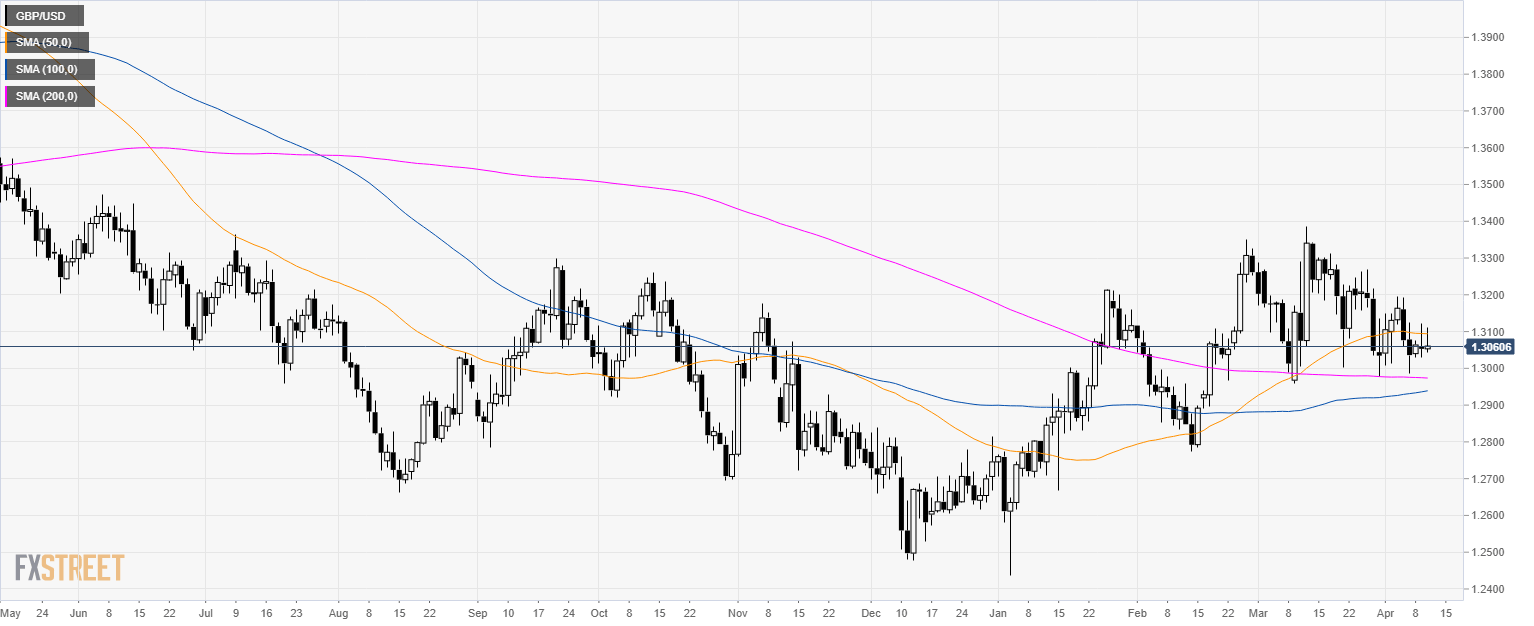
GBP/USD daily chart
- GBP/USD is consolidating above the 200-day simple moving average (SMA) while rejecting the 1.3100 level and the 50 SMA.

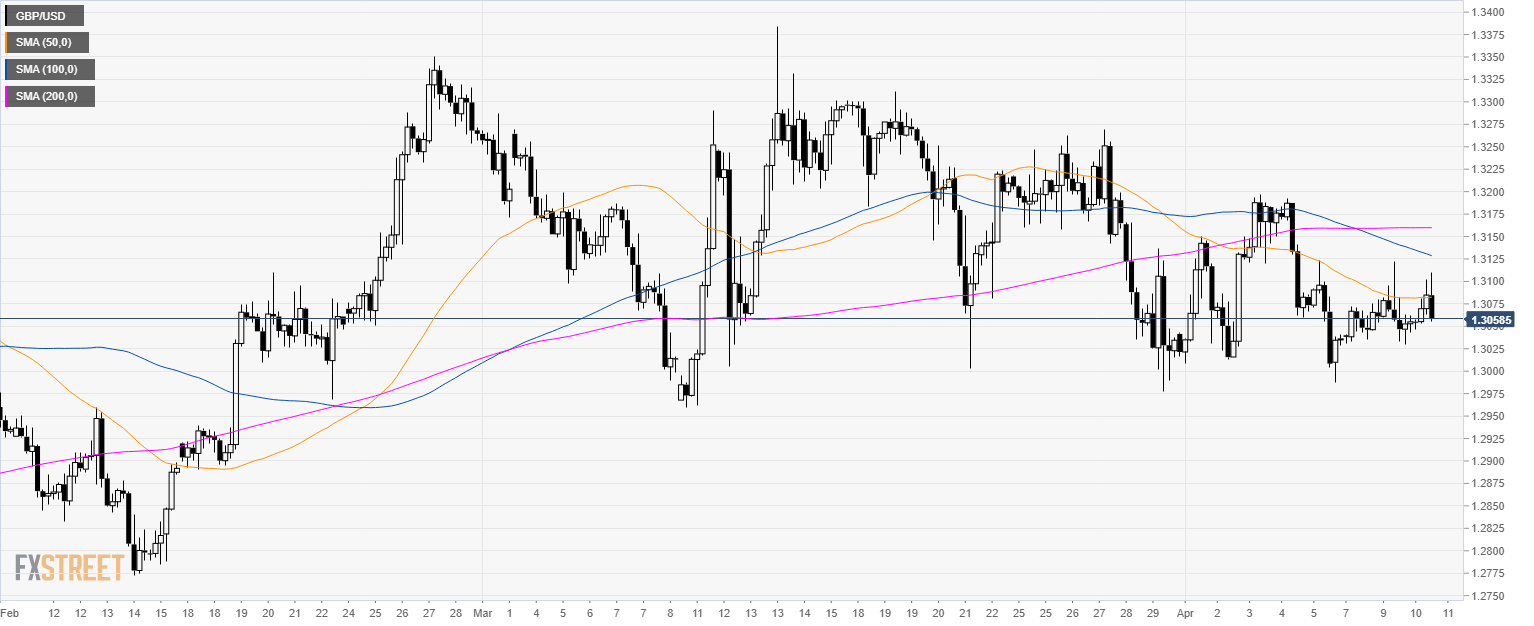
GBP/USD 4-hour chart
- GBP/USD is trading below its main SMAs suggesting bearish momentum in the medium-term.

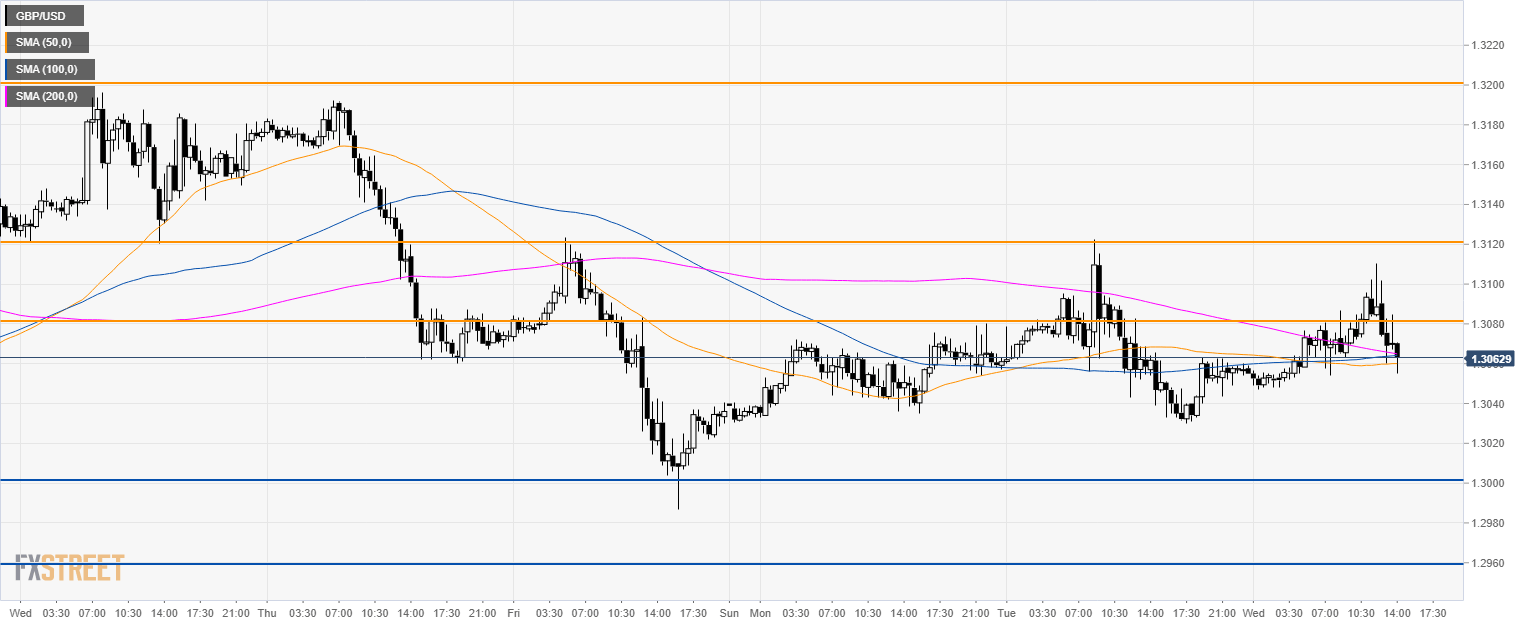
GBP/USD 30-minute chart
- GBP/USD is trading below its main SMAs suggesting bearish momentum in the short-term.
- The main support to the downside is seen at 1.3000 and 1.2960 level.
- Immediate resistance is seen at 1.3080 and 1.3120 level.

Additional key levels
