Back


2 Oct 2019
EUR/USD technical analysis: Euro clings to daily gains above 1.0926 level
- EUR/USD is rolling into the Asian session near daily highs.
- The level to beat for bulls is the 1.0940 resistance.
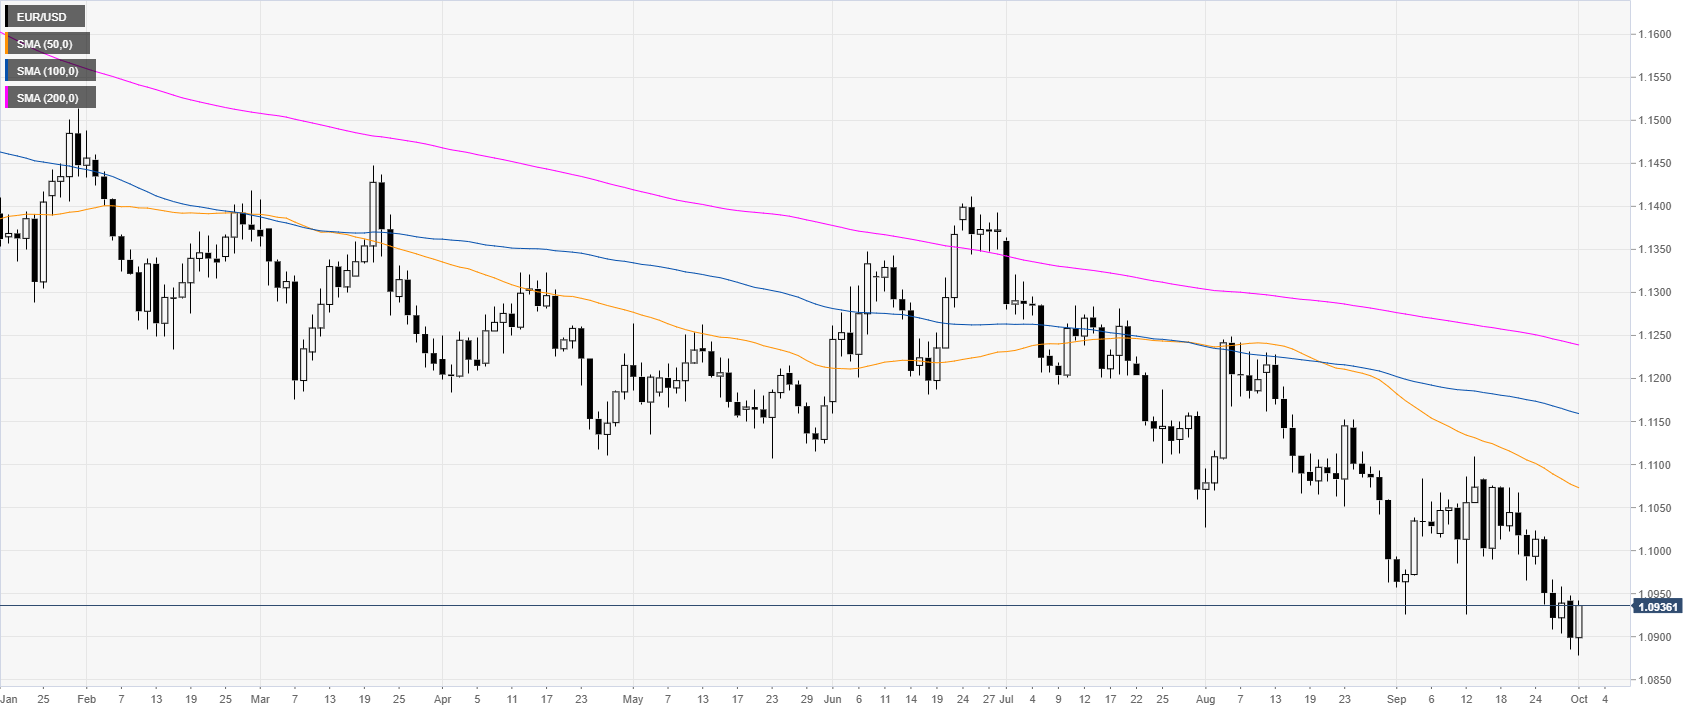
EUR/USD daily chart
The shared currency, on the daily chart, is trading in a bear trend below its main daily simple moving averages (DSMAs). This Tuesday, the ISM Manufacturing PMI dropped to 10-year low at 47.8 vs. 50.1 expected in September.

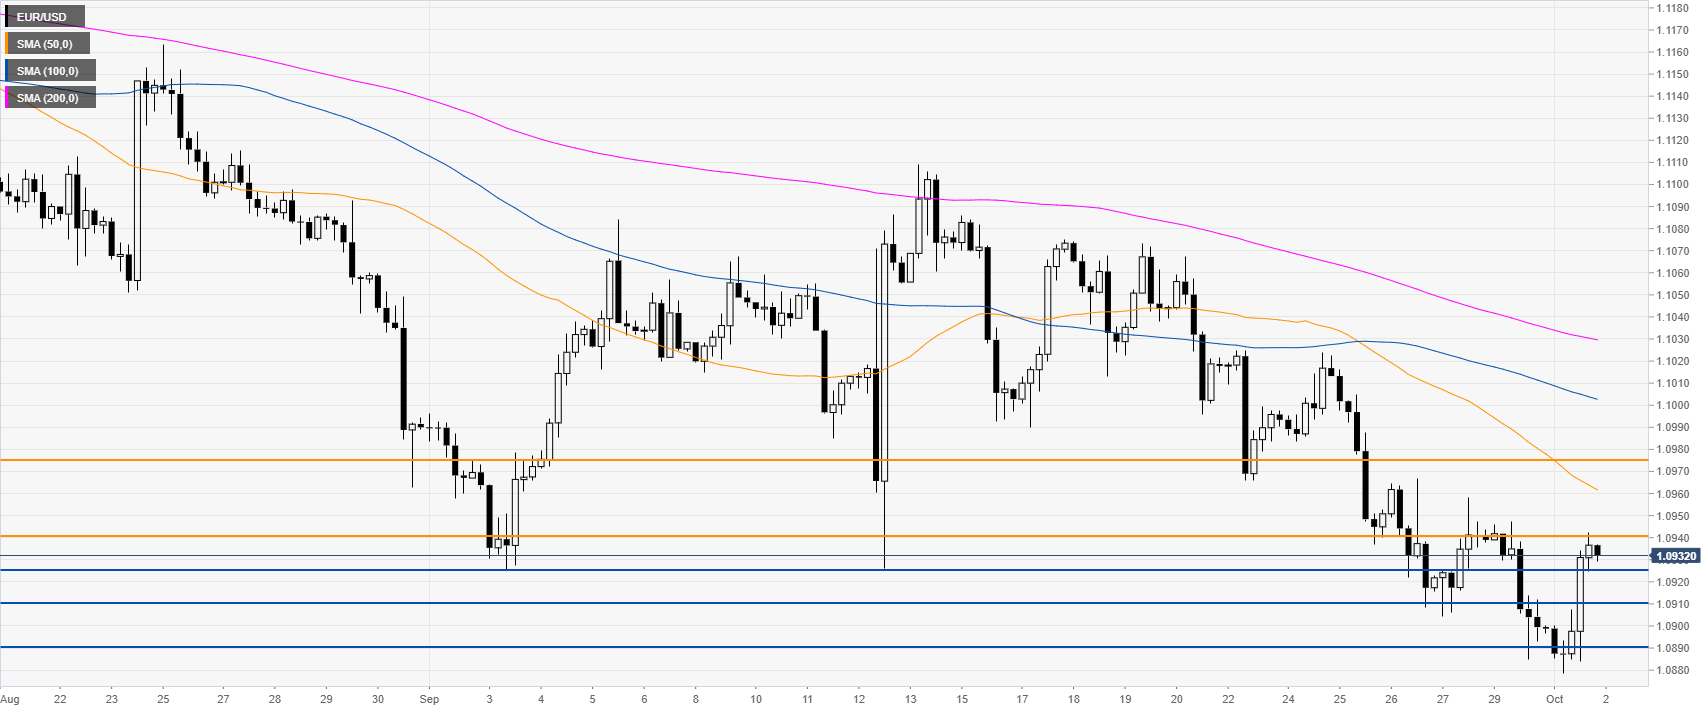
EUR/USD four-hour chart
EUR/USD is trading below the main SMAs, suggesting a bearish bias in the medium term. However, a break of 1.0940 can expose the 1.0975 resistance, according to the Technical Confluences Indicator.

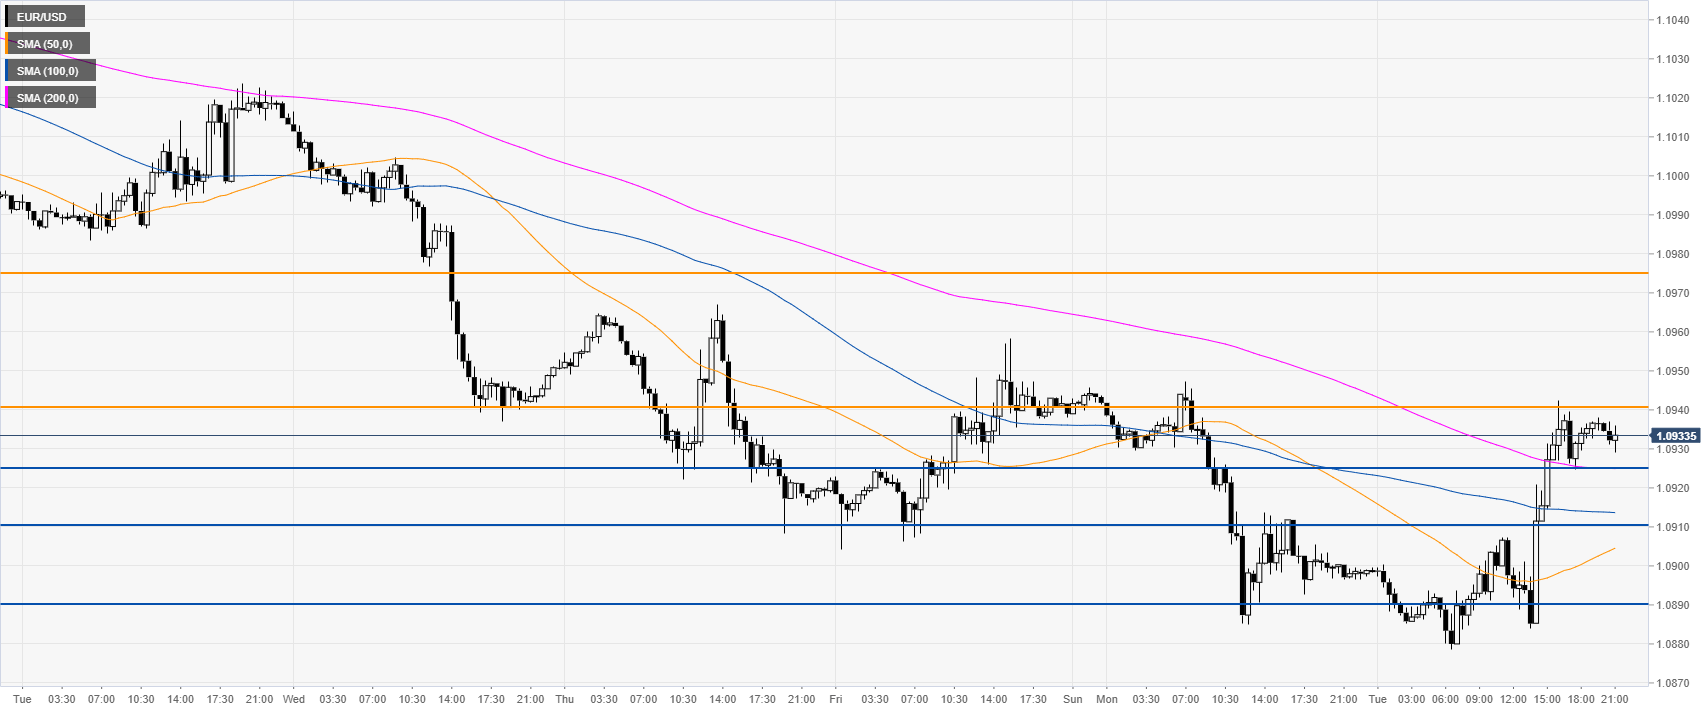
EUR/USD 30-minute chart
EUR/USD is trading above the main SMAs, suggesting bullish momentum in the near term. Immediate support is seen at the 1.0926 level followed by 1.0910 and 1.0890 level, according to the Technical Confluences Indicator.

Additional key levels
