NZD/USD technical analysis: 0.6342/36 becomes a tough nut to crack for sellers
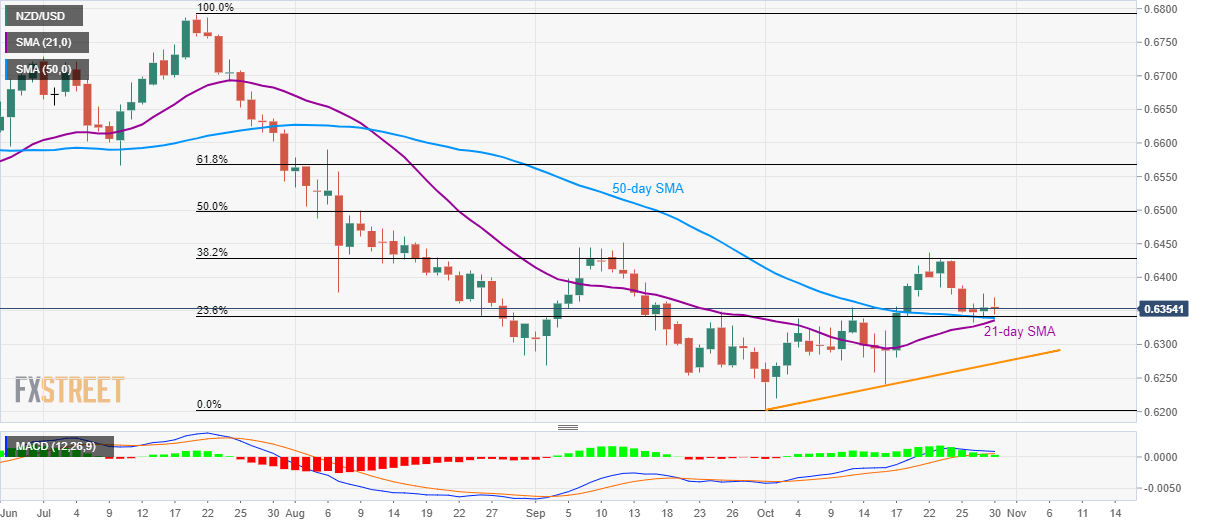
- NZD/USD nears key support confluence following its U-turn from 38.2% Fibonacci retracement.
- 21/50-day SMA and 23.6% Fibonacci retracement limit the pair’s downside towards monthly rising trend line.
Despite witnessing a pullback during the last one week, NZD/USD refrains from breaking the key support confluence while taking rounds to 0.6355 during early Wednesday.
Prices stay above 21-day and 50-day Simple Moving Averages (SMA), as well as 23.6% Fibonacci retracement of July-October downpour, around 0.6342/36, which in turn portrays the pair’s underlying strength.
However, 38.2% Fibonacci retracement level near 0.6430, followed by September month high close to 0.6455, seems to limit the pair’s immediate upside.
In a case where buyers sneak in around 0.6455, 50% Fibonacci retracement close to 0.6500 will become their favorites.
Alternatively, pair’s sustained break below 0.6336 will set the tone for the next round of declines targeting monthly rising support line, at 0.6270, and monthly bottom close to 0.6200.
NZD/USD daily chart

Trend: pullback expected
