Gold Technical Analysis: Bearish spinning top below 50-DMA make sellers hopeful
- Gold stays on the back foot after declining the previous day.
- A U-turn from the near-term key moving average, bearish candlestick formation indicates further downside.
- Bullish MACD, repeated bounces off $1,450/45 favors the buyers.
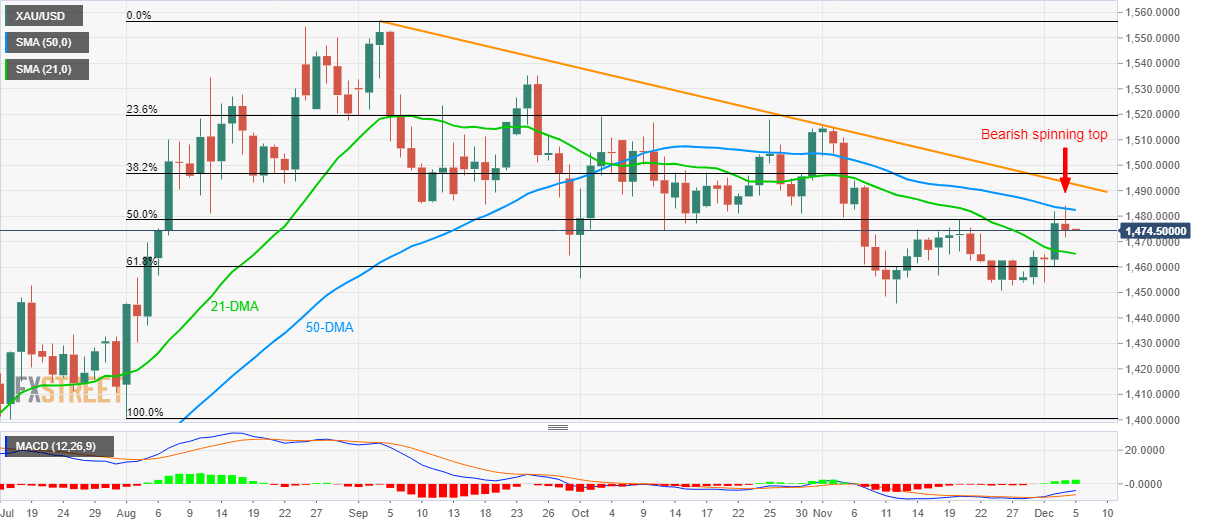
Gold prices decline to $1,474.50 amid the initial Asian session on Thursday. The bullion pulled back from 50-Day Simple Moving Average (DMA) while portraying a bearish candlestick formation during the previous day.
That said, the 21-DMA level around $1,465/66 can act as immediate support ahead of 61.8% Fibonacci retracement of August-September upside, at $1,460. However, the safe-haven’s additional fall could repeat its November month reversal from $1,450/45 support-zone.
In a case the yellow metal fails to respect $1,445, July 25 top near $1,433 and August bottom close to $1,400 will be on bears’ radar.
On the upside, a daily closing beyond 50-DMA level of $1,482 can trigger the quote’s run-up to confront a three-month-old descending trend line, at 1,493.
Though, a successful rise past-$1,493 will be a call for the Bulls to target $1,500 and the previous month pear surrounding $1,515.
Gold daily chart
Trend: Bearish