Back
23 Mar 2020
Silver Price Analysis: XAG/USD bounces off 2020 lows, challenges $13.00/oz
- XAG/USD is bouncing off the 2009 lows as Fed goes all in.
- Immediate resistance can be seen near the 13.00 figure.
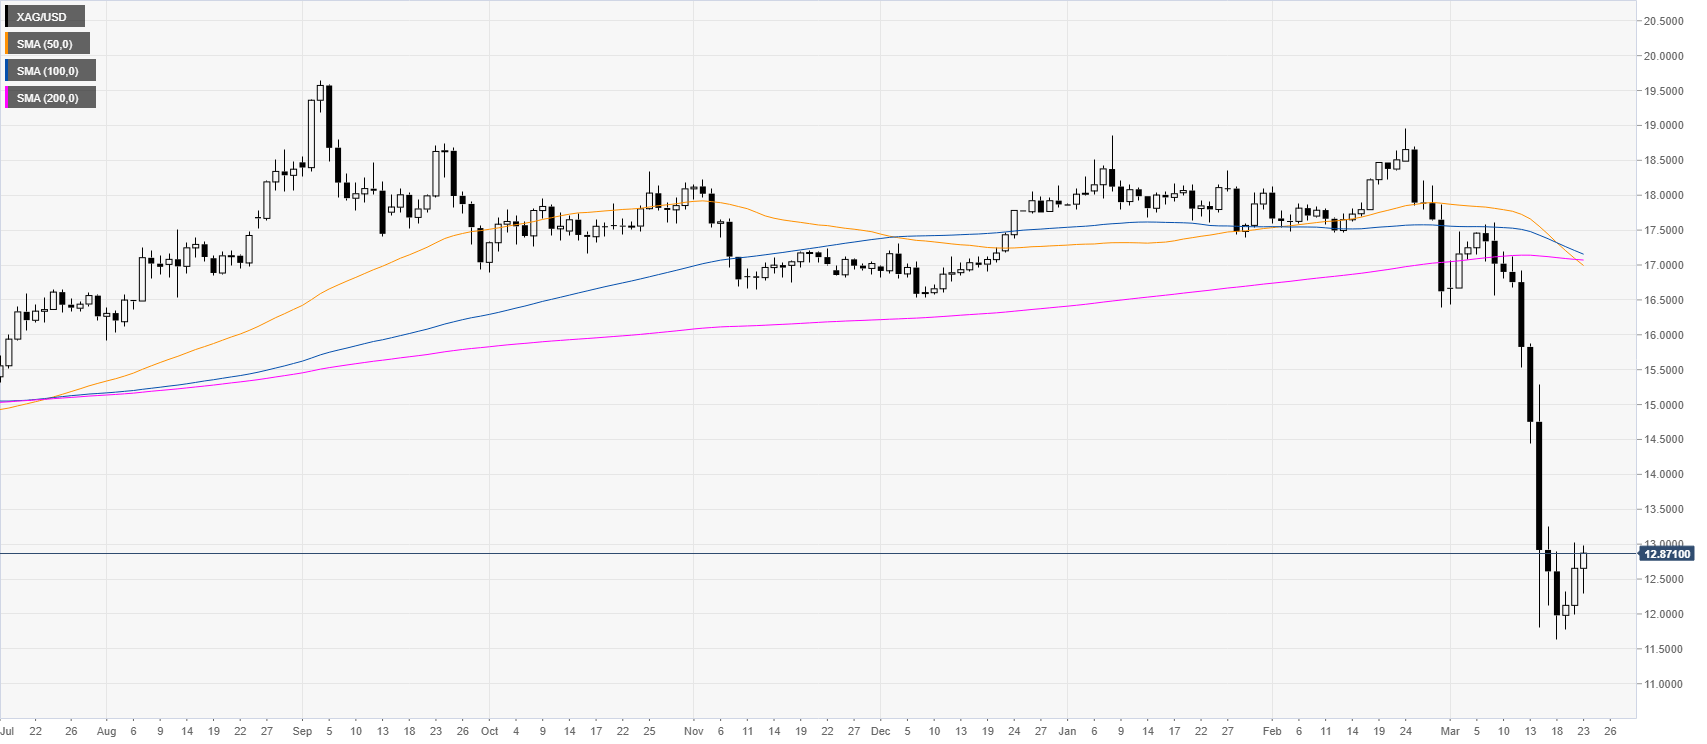
Silver daily chart
After the slump to 2009 lows, silver is bouncing while below the 13.00 figure. However, XAG/USD could remain vulnerable to the downside. The Fed announces unlimited Quantitative Easing (QE) to face the coronavirus crisis.
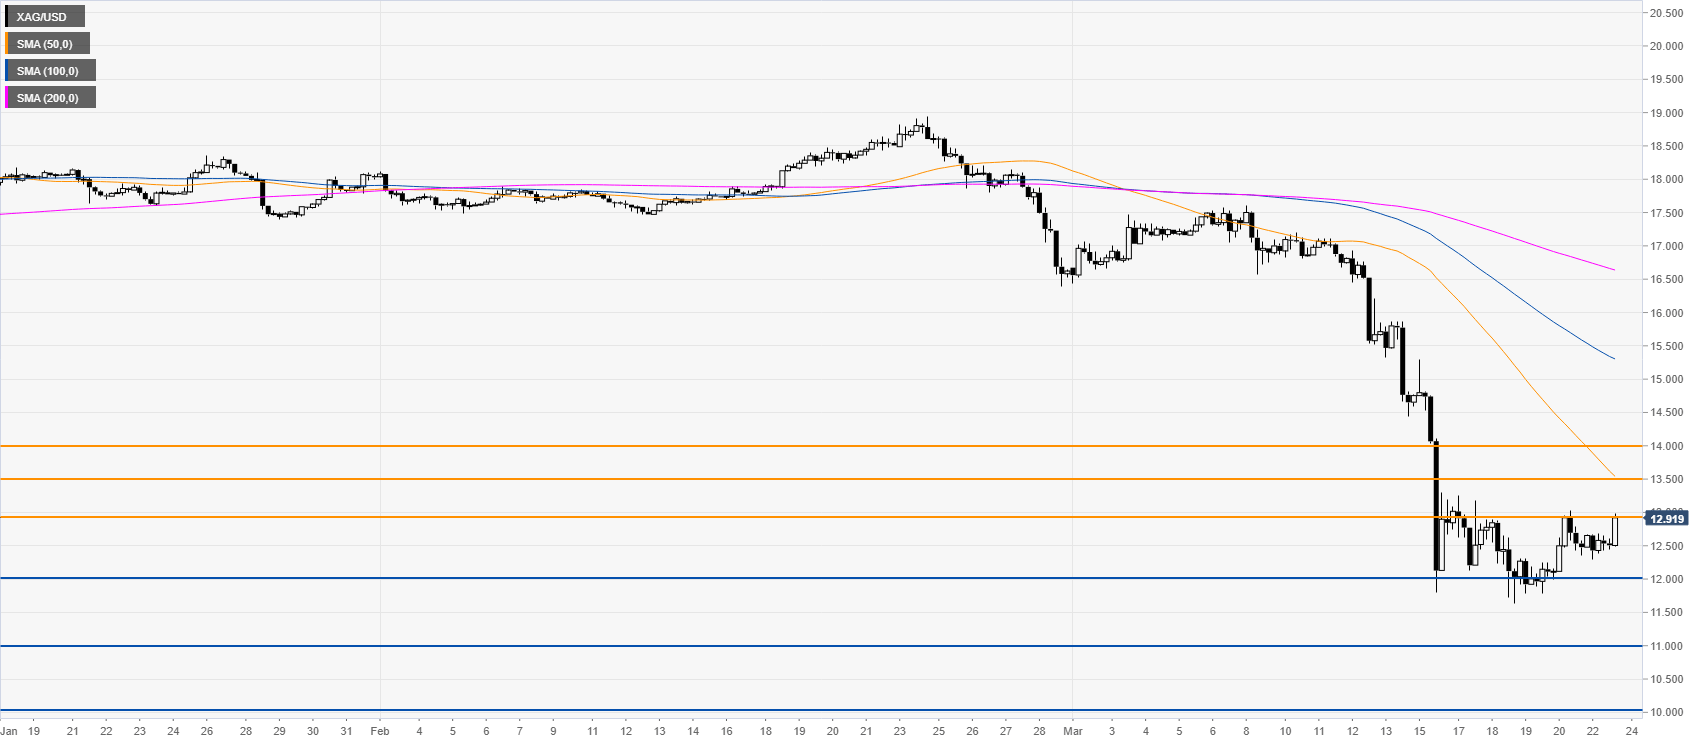
Silver four-hour chart
Silver is trading below the main SMAs, however, the market is challenging 13.00 resistance. In the event of a break beyond this level, XAG/USD correction can extend towards the 13.50 and 14.00 levels while support is seen near the 12.00 and 11.00 price levels on the way down.
Resistance: 13.00, 13.50, 14.00
Support: 12.00, 11.00, 10.00
Additional key levels