GBP/USD Price Analysis: Multiple supports question pullback from 200-day SMA
- GBP/USD fails to extend the previous day’s losses, recovers from 1.2556.
- A confluence of 100-day SMA and 61.8% Fibonacci retracement offer immediate strong support.
- The joint between 50-day SMA and a three-month-old support line adds to the downside back-up.
- The monthly top can challenge the pair’s rise beyond 200-day SMA.
GBP/USD bounces off intraday low while taking the bids near 1.2577 during the early Asian session on Wednesday. The pair took a U-turn from 200-day SMA on Tuesday but sellers seem to relinquish the controls off-late. It should also be noted that the MACD histogram is still bullish, though mildly, and favor the Cable’s pullback.
In doing so, 1.2600 and 1.2650 might offer immediate resistance to the pair ahead of a 200-day SMA level of 1.2694. Also acting as a strong upside barrier will be the monthly top of 1.2813.
Should the bulls manage to cross 1.2813 daily, it’s the run-up to 1.3000 can’t be ruled out.
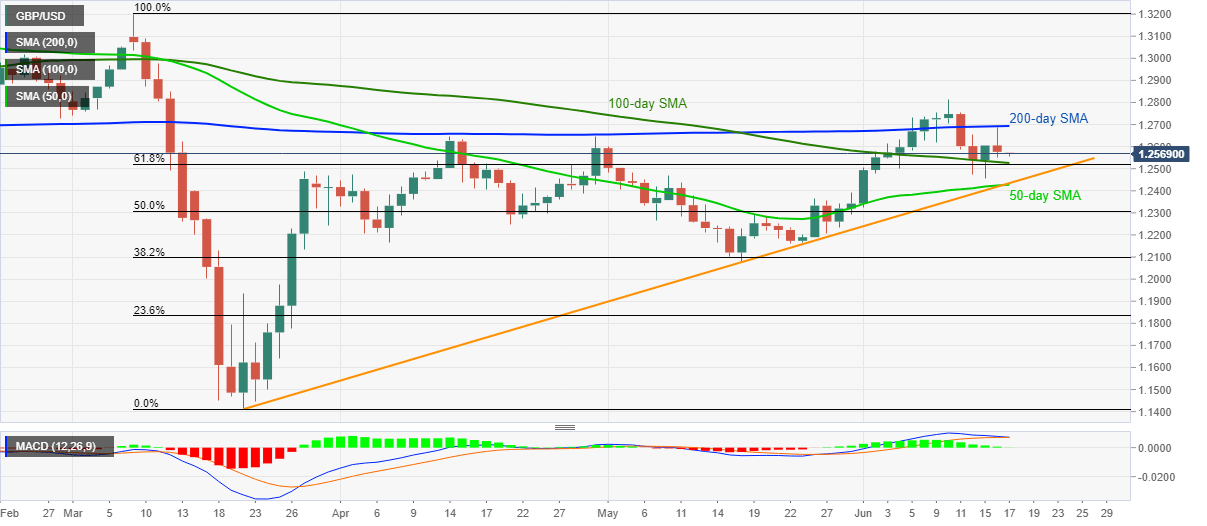
Meanwhile, 1.2525/20 are comprising 100-day SMA and 61.8% Fibonacci retracement of March month fall could restrict the pair’s immediate downside.
Additionally, an ascending trend line from March 20 and 50-day SMA, near 1.2425, might as well challenge the bears.
GBP/USD daily chart
Trend: Pullback expected