NZD/USD Price Analysis: Prints symmetrical triangle on 30-minute chart under 0.6700
- NZD/USD struggles to extend recoveries from 0.6650, stays near the highest since early January 2020.
- Sustained trading beyond 0.6630, coupled with likely trade-positive MACD conditions, can help bulls to refresh the yearly top.
- Sellers will have 200-bar SMA as an additional downside hurdle to tackle.
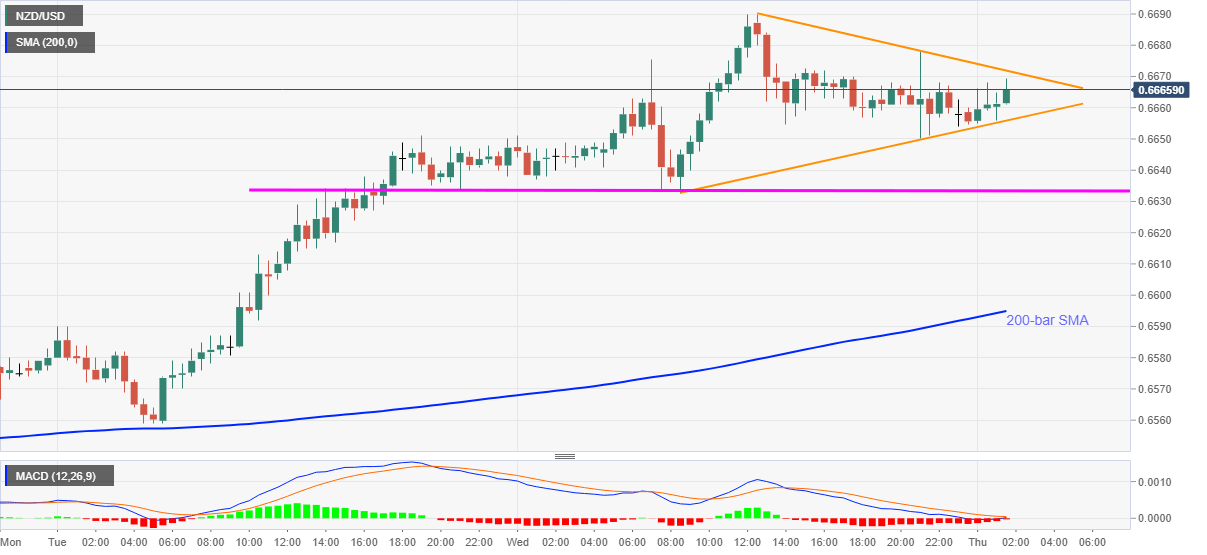
NZD/USD pick-up bids around 0.6665, up 0.10% on a day, amid the Asian session on Thursday. The kiwi pair portrays a symmetrical triangle formation on the 30-minute chart following its pullback from 0.6690, the highest from January 03, 2020.
Considering the pair’s latest bounce off the pattern’s support and likely recovery of the MACD conditions in favor of the buyers, the quote can refresh the yearly to surrounding 0.6745 on the break of 0.6672 immediate resistance.
It’s worth mentioning that December 31, 2019 peak of 0.6756 and 0.6800 are extra upside barriers that the bulls will aim to confront during the further rise past-0.6745.
Alternatively, a downside break of 0.6655 will again highlight 0.6630 horizontal support that has been pushing the sellers off the table.
Though, the pair’s weakness past-0.6630 can recall a 200-bar SMA level of 0.6595 on the chart.
NZD/USD 30-minutes chart
Trend: Bullish