USD/JPY Price Analysis: 200-HMA guards the upside ahead of US data
- USD/JPY faces stiff resistance at 200-HMA of 106.23.
- Bulls consolidate before regaining upside momentum.
- Next of relevance remains the US Jobless claims data.
USD/JPY extends its Asian side trend in the European session, as the bulls consolidate the previous surge amid the risk-off market mood and sliding US Treasury yields.
Although, the FOMC minutes inspired dollar gains continue to limit the downside attempts in the spot.
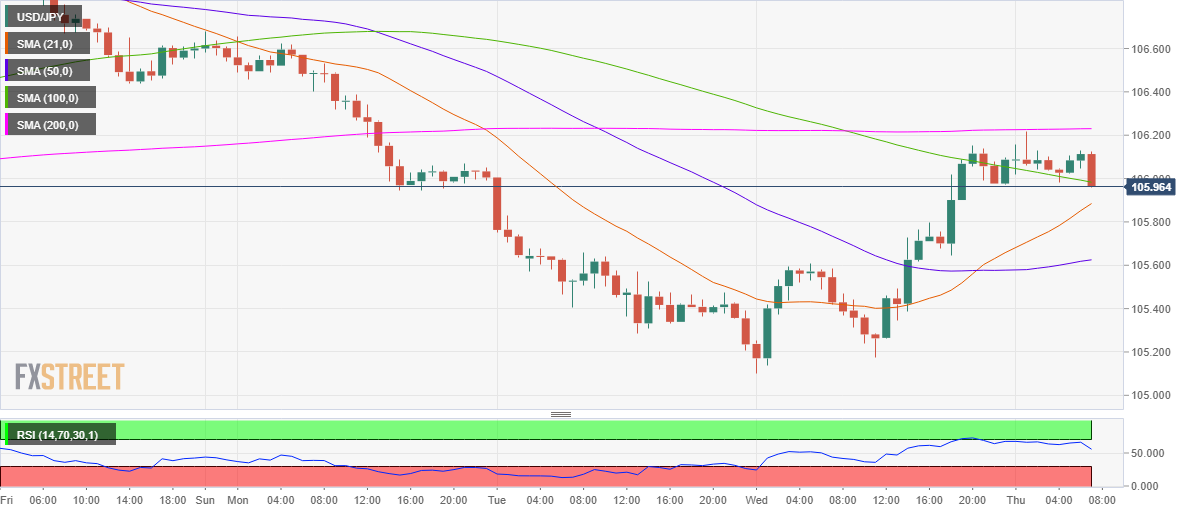
From a near-term technical perspective, the price is ranging between two key Simple Moving Averages on the hourly chart, with the horizontal 200-HMA at 106.23 capping the move higher while the 100-HMA at 105.98 lends support to the bulls.
The further upside will be on the cards only on a sustained break above the 200-HMA.
While the sellers look to test the next support of inward-sloping 21-HMA at 105.88 should USD/JPY dive out from the range trade.
Further south, the horizontal 50-HMA at 105.62 will be tested.
USD/JPY: Hourly chart
USD/JPY: Additional levels