Back
28 Dec 2020
AUD/JPY Price Analysis: Hits highest since April 2019
- AUD/JPY hits multi-month highs on US stimulus.
- The pair eyes key SMA hurdle, as the weekly chart favors a continued rally.
Buoyed at least in part by President Trump's signing of the coronavirus stimulus package, AUD/JPY reached 20-month highs on Monday.
The currency pair traded at 78.88, the highest level since late April 2019, having picked up a bid at 78.54 in early Asia.
According to the last week's bullish hammer candle, the path of least resistance is to the higher side. The above-50 readings on the daily and weekly chart relative strength indices also indicate a bullish bias.
The immediate resistance is located at 79.12 (200-week Simple Moving Average), followed by 80.72 (April 2019 high). Meanwhile, 77.49 (last week's low) is the level to beat for the sellers.
Weekly chart
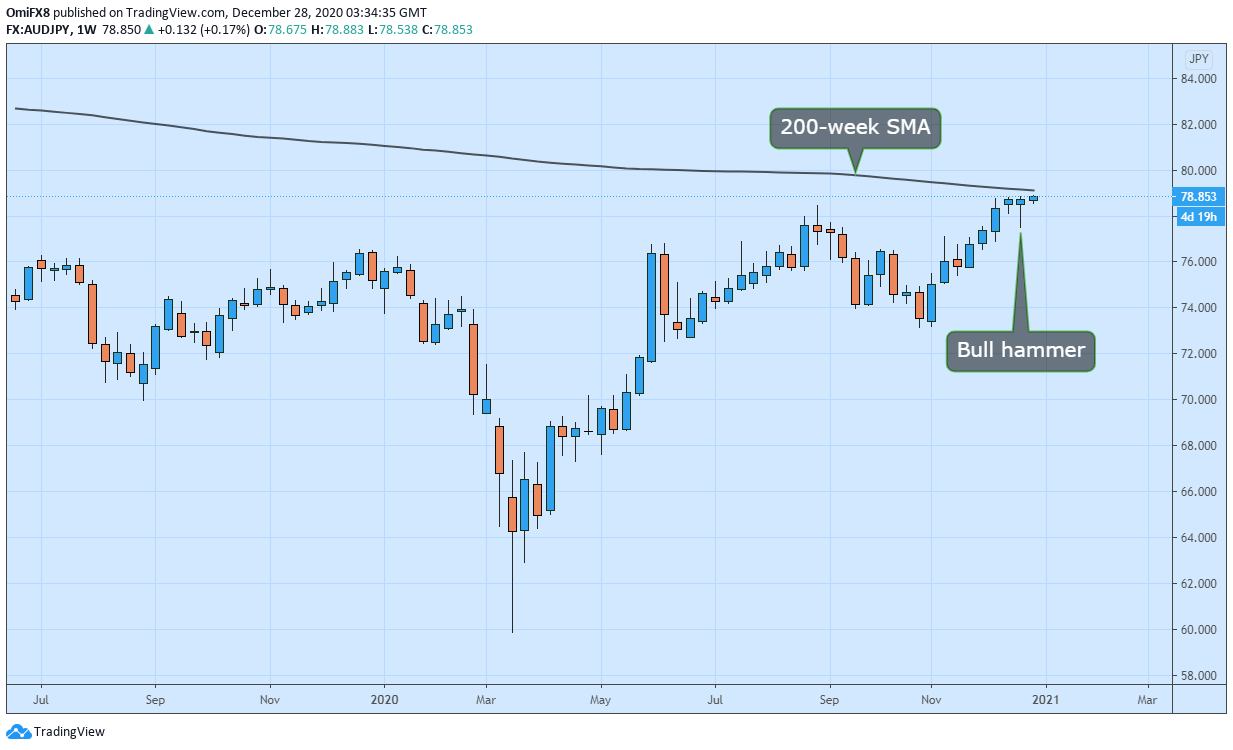
Trend: Bullish
Technical levels