DXY attempts to recover as US stocks continue to bleed
- USD bulls are stepping in at a significant area of support as stocks fall.
- Market positioning is net longer USD, and spot could play catch up in the coming days/weeks.
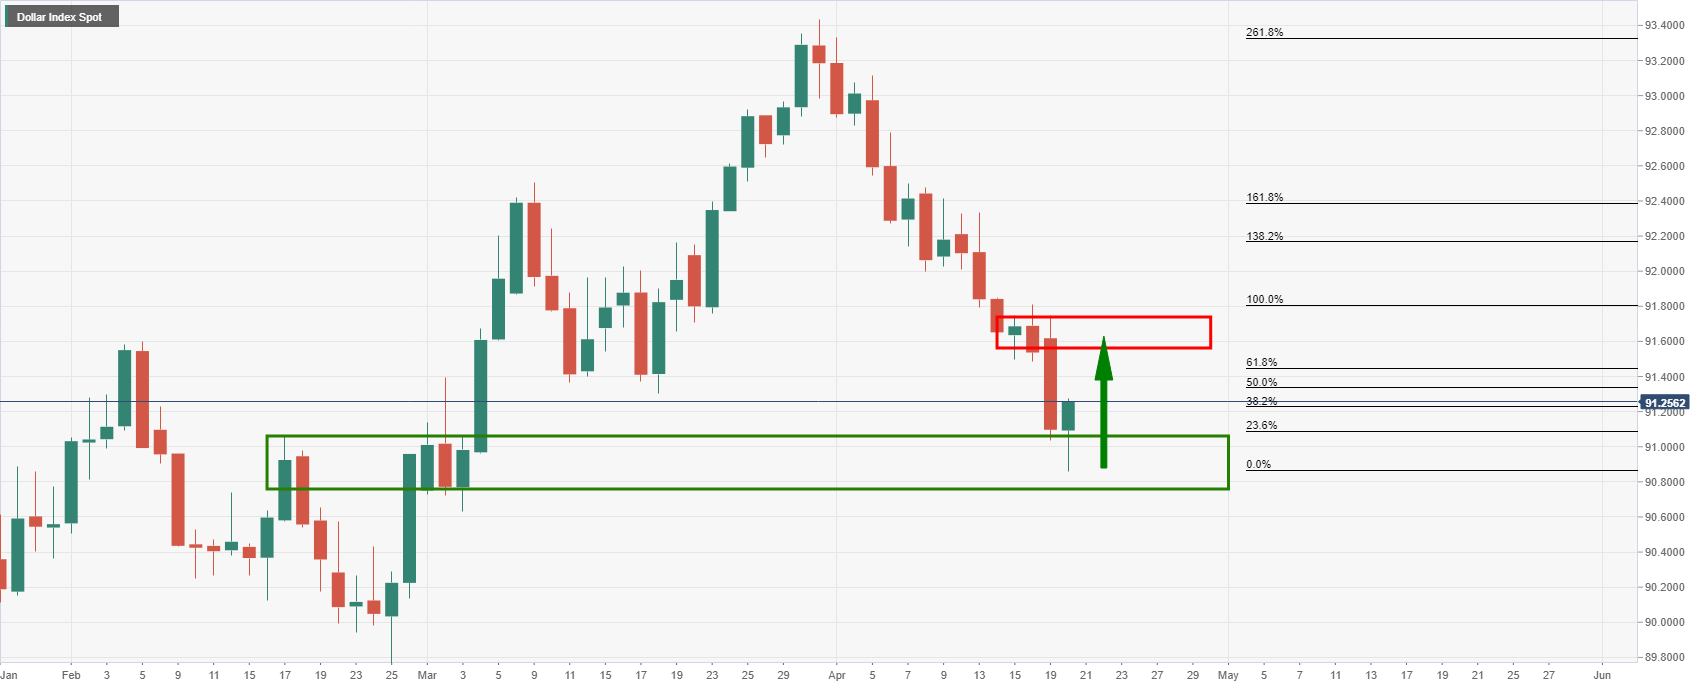
The US dollar remains downtrodden for the seventh consecutive session as measured by the DXY index vs a basket of currencies which printed a fresh low of 90.8560.
However, in more recent trade, the index has travelled 0.17% higher in a drift back to 91.2580.
The upside is a feasible prospect at this stage.
The DXY is meeting a significant support area and as for positioning, speculators’ net USD position edged higher with a positive print for the fifth consecutive week
Moreover, a wider measure of dollar positioning shows that the greenback posted a net short position of $5.71 billion this week, from net shorts of $7.75 billion the week before.
There is still plenty of appetite for the greenback out there, but the prospects of narrowing the vaccination gap with Europe is weighing on the dollar as are lower US yields.
Having said that, the 10-year yield traded near 1.63% today, the highest since last Thursday.
1.53% was the low posted last week which gives some prospects of recovery from weekly lows.
''We still like the dollar higher but this drop in US yields from the 1.77% high on March 30 continues to weigh on the greenback,'' analysts at BBH said, noting that the bond markets await a $24 bln 20-year bond auction tomorrow and a $18 bln 5-year TIPS auction Thursday.
Elsewhere, as the decoupling in yields unfolds, the US stock market could be a catalyst for a higher US dollar if Wall Street continues to bleed out.
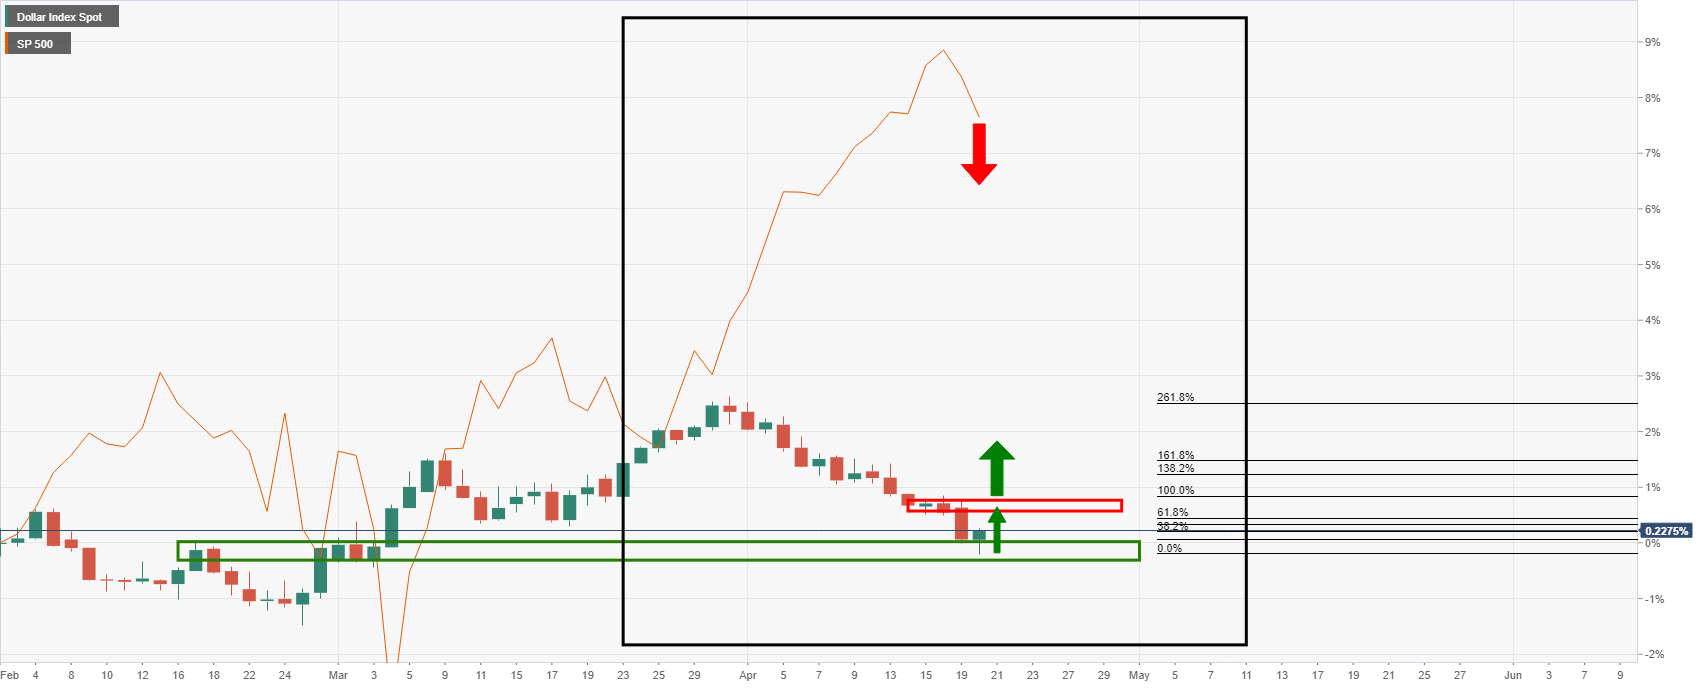
Stocks/DXY negative correlation
Stocks are down on the day and a worthy note from the Bank of America today stated that BofA Securities clients last week were big sellers of stocks with outflows the largest in five months.
''Clients were net sellers of US equities to the tune of $5.2 billion, the biggest sales since mid-November and the fifth largest in data history since 2008, according to a BofA Global Research Equity & Quant Strategy report,'' Reuters reported.
The following daily chart illustrates the negative correlation that the S&P500 and DXY have had in recent weeks:
DXY daily chart